Wine Dashboard Project 🍷
View Completed Project
(Note that you won't be able to change the drop-down menus, as this file is read-only)
The wine dashboard project walks you through the process of taking a large data file in Excel and turning it into a usable dashboard, complete with graphs and drop-down menu selections. The dashboard shows the amount of wine consumed by different countries over time.
Skills to Know:
CONCAT Function
Drop-Down Lists
VLOOKUP Function
Absolute References
Start the Wine Excel Dashboard Project
Start by downloading the Wine Excel data file. You can also follow along with the video HERE. You'll turn this raw data in an Excel spreadsheet into a nice dashboard.
Look at all this data! We want to turn it into a nice dashboard using VLOOKUPs which look up data of a specific country for a specific year, but the country column and year column are separate. How can we do a VLOOKUP to find, for example, wine consumption for Mongolia in 1990 when country name and year are in two separate columns?
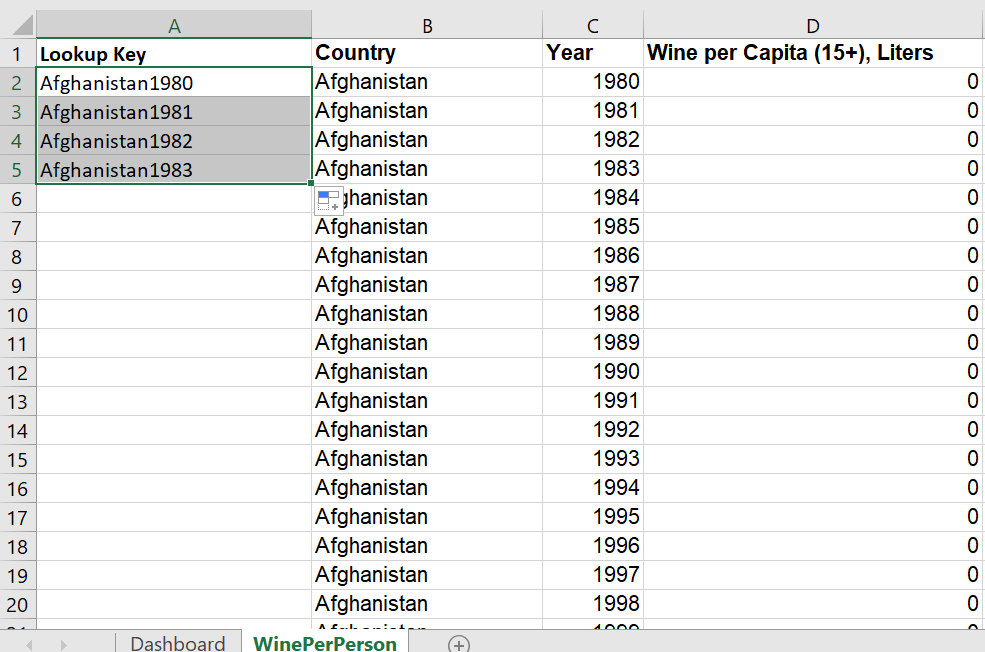
Add a column to the left of the "Country" column and name it "Lookup Key." Select cell A2 and use a function to join the country name and the year, so that the value in A2 is Afghanistan1980. Try it yourself, and if you need help click the button to reveal the answer in the box below.
=CONCAT(B2, C2)
Or
=B2&C2
Grab the handle in the bottom right corner of cell A2 and drag the formula all the way down to the bottom of the column.
Copy the entire list of country names, then page over to the Dashboard worksheet and paste the list into cell B30. With the entire list still selected, use Remove Duplicates in the data tab so that each country appears in the list only once.
Setting Up the Year Over Year Trend
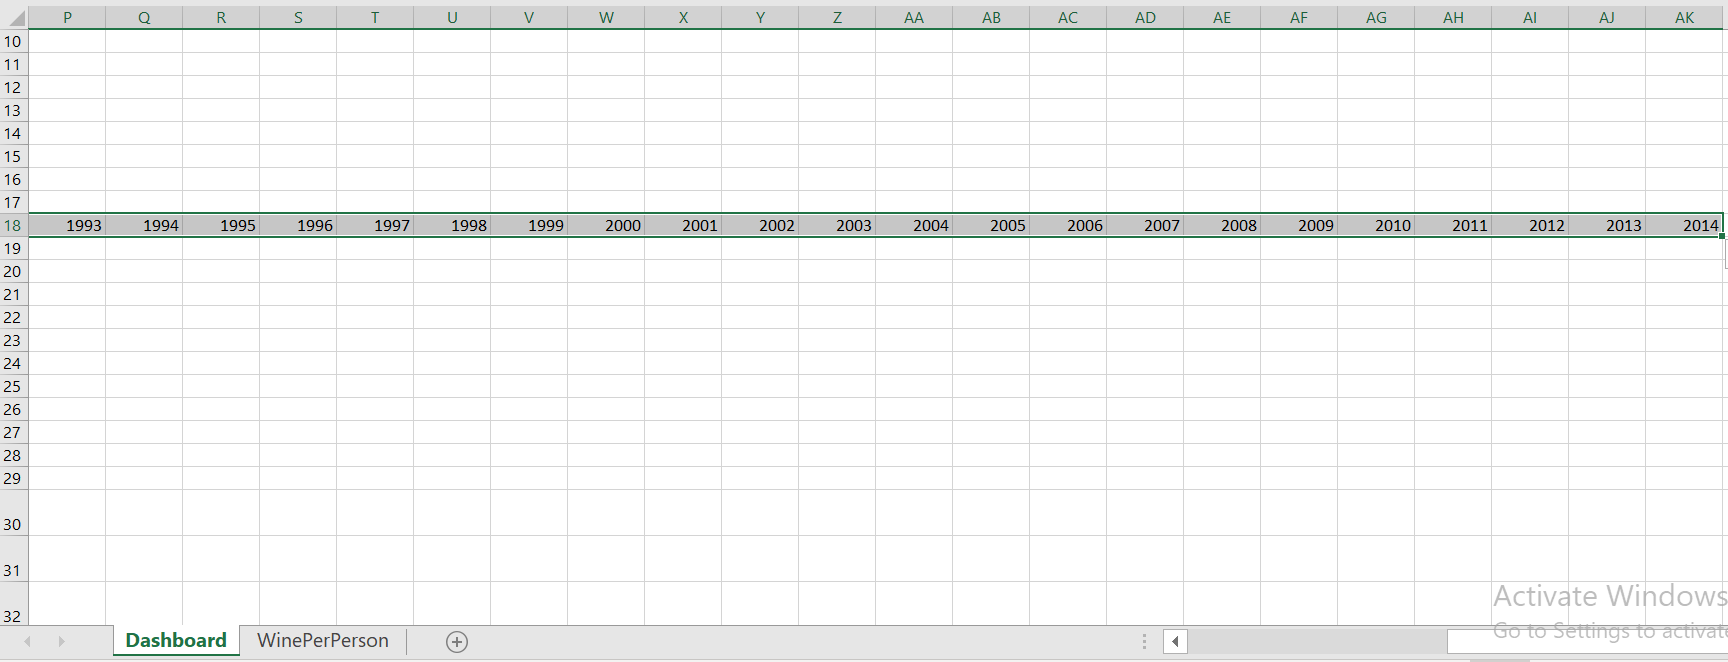
Select the three cells which contain years in row 18, then click the handle in the lower-right corner of the cells and drag them over to the right until cell AK18. The last cell should contain the year 2014.
With all the year cells still selected, change the font size to 9 in the Home tab. Hold the Control key and press the Space bar to select columns C through AK. In the Home tab, select Format and click Cell Size, then Column Width and set it to 5. This changes all the column widths to 5. Next, select the title in cell B1, make the text bold and size 20, then make it a nice color. Then change column B's width to 15.
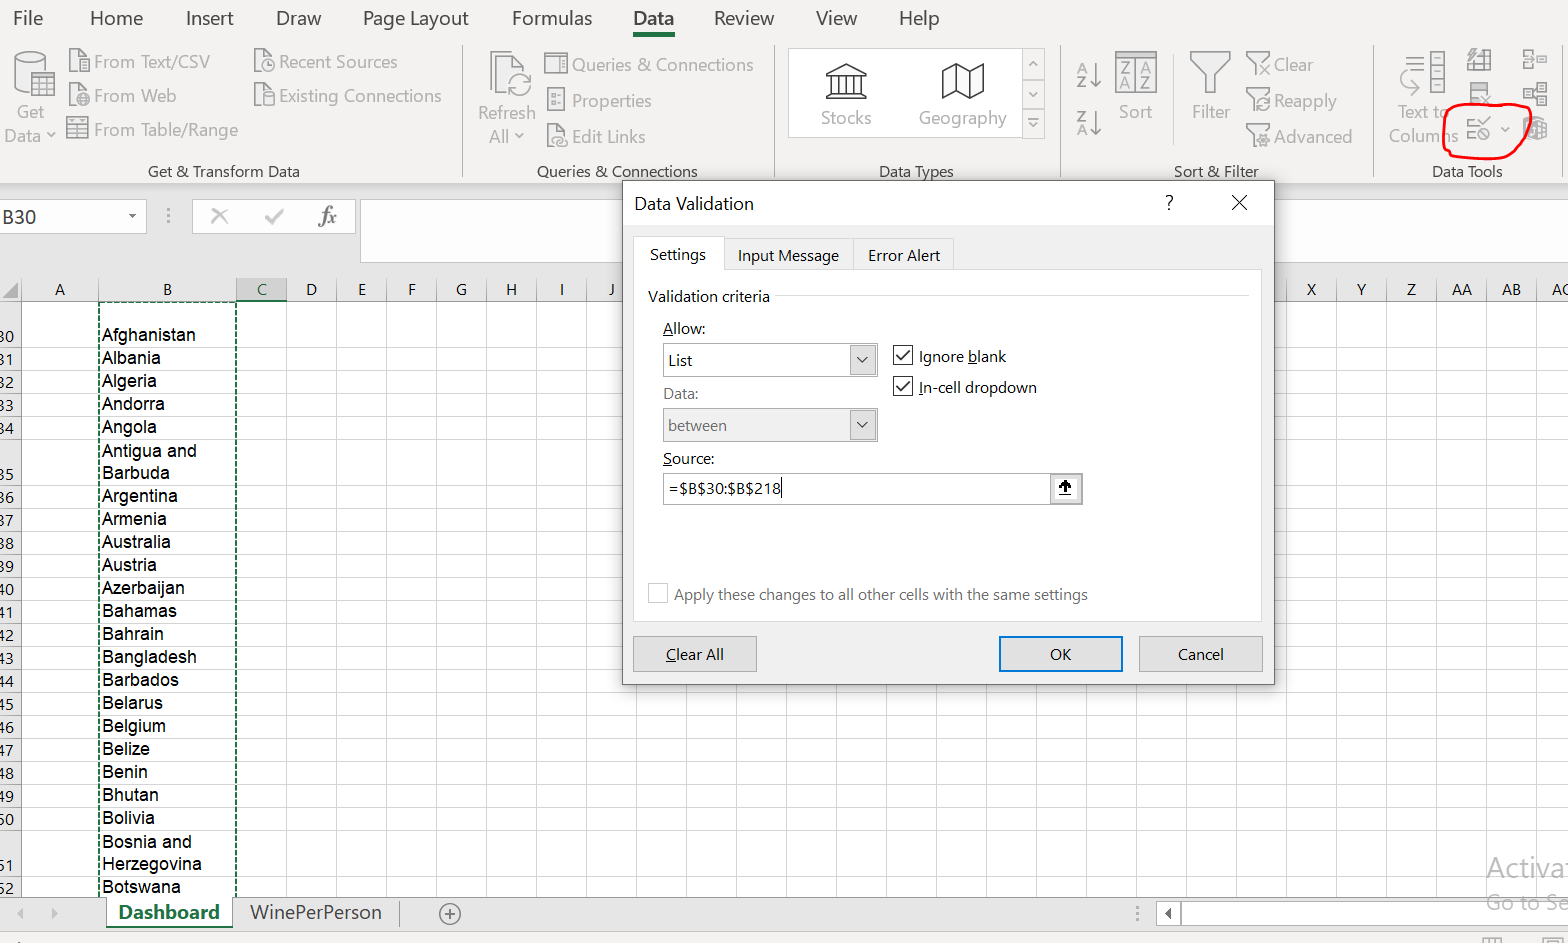
Select cell C3 and in the Data tab, click Validation and select List. Click in the Source field and select cells B30 to B218. This tells Excel to allow a drop-down list of values with options for all the cells in the source range. You can either click in the field then click on the worksheet and select the necessary cells, or you can just type B30:B218 directly into the source field. Next, select cell C21 and go through the same data validation process for all the years (cells C18:AK18). You now have two working drop-down lists. In the country list, select Algeria.
In C17 write a VLOOKUP that searches the data table (in the WinePerPerson worksheet) for the concatenation of Country and Year, where the country value comes from the drop-down list in cell C3 and the year value comes from the year in cell C18, and returns the wine per capita for that country and year. If you need help with this formula click the button to reveal the answer in the box below.
=VLOOKUP(CONCAT(C3, C18), WinePerPerson!A:D, 4, FALSE)
Absolute References
Important! Because we will drag this formula from left to right, Excel will want to update the column of each cell reference in the formula. To mitigate this, we need to lock the appropriate cell references. Place one dollar sign ($) in front of C3 in the formula, and a dollar sign in front of the A and D in the second argument.
=VLOOKUP(CONCAT($C3, C18), WinePerPerson!$A:$D, 4, FALSE)
Handling Errors
Now these columns will stay locked in place as you click the bottom corner of cell C17 and drag the formula to the right all the way to cell AK17. Now you have the amount of wine consumed per capita in Algeria for each year with one little problem: there's an error in cell AK17. That's because, if you check the WinePerPerson tab, there is no Algeria2014 - the 2014 value is missing from our data! To solve this, we'll enclose the entire VLOOKUP in an IFERROR function. The IFERROR function attempts one formula and, if there's an error, returns a different value instead.
=IFERROR(formula, value_if_error)
We just want a 0 if the data is missing, so we'll use the VLOOKUP as the first argument and 0 as the second argument. So, if you go back to cell C17, your formula should be as follows:
=IFERROR(VLOOKUP(CONCAT($C3, C18), WinePerPerson!$A:$D, 4, FALSE), 0)
This tells Excel to try the VLOOKUP, but just return 0 if the VLOOKUP gives an error. Now drag this formula all the way across to cell AK17. You should now see 0 in AK17 instead of the error.
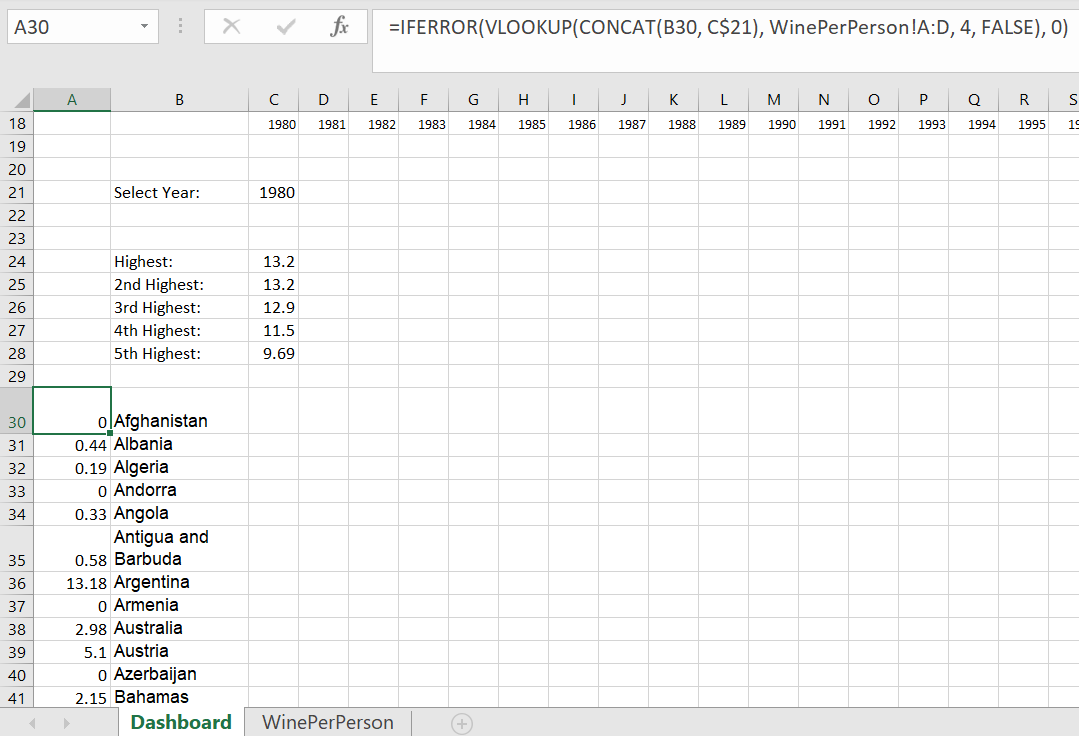
In cell A30 do the same thing by concatenating the country in B30 with the year in the drop down menu and using it in a VLOOKUP (with IFERROR) and copying the formula all the way down to cell A218.
Ranking the Top 5 Countries
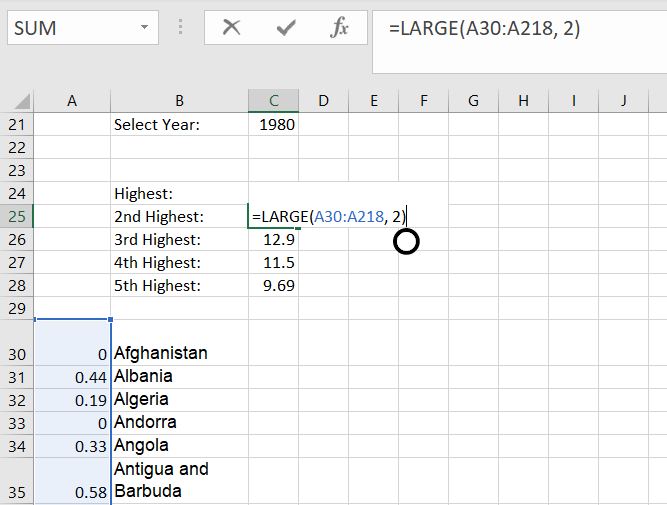
Now in cells C24 through C28 we want to rank the top 5 numbers from the values in A30:A218. Use a function to get the largest value from the list, second largest value from the list, third largest, and so on for cells C25 through C29. Try it yourself, and if you get stuck click the button below to reveal the answer in the box.
=LARGE(A$30:A$218, 1)
=LARGE(A$30:A$218, 2)
=LARGE(A$30:A$218, 3)
=LARGE(A$30:A$218, 4)
=LARGE(A$30:A$218, 5)
Next, click on cell D25 and use a VLOOKUP on the data in A31:B219 to return the country that matches the number in C25.
=VLOOKUP(C25, A$31:B$219, 2, FALSE)
Do the same for cells D26 through D29.
Adding Excel Charts
In cell B4 write "Select Country" and in cell B22 write "Select Year". Make these cells bold.
Select the data in cells C17 to AK17. Click the Insert tab and click the line chart. A line chart should apear showing the trend of data in C17:AK17. Highlight cells C24 to C24 and click the Insert tab and select the horizontal bar chart. Select the title of the line chart, then click in the formula bar and type =Dashboard!$B$5. This should change the chart title to the text in B5 and should change when you pick a new country in the drop-down list. Do the same for the horizontal bar chart with the cell B23.
Right click the line chart and click Select Data. Click the edit button under "Horizontal (Category) Axis Labels" and select cells C19:AK19. This should put the years along the horizontal axisf the chart. Similarly, add the country names in D25:D29 for the axis of the horizontal bar chart.
Select column A, and in the Home tab click Format and choose Column Width and enter 2. Select rows 30 through 218, then click the Data tab, and click Group. On the left side of the spreadsheet you'll see a button with a "-" sign. Click the button to hide the grouped rows. Finally, click the View tab and uncheck the "Gridlines" box.
You Now Have a Working Excel Dashboard
You now have an Excel dashboard that you're ready to show your boss! Feel free to update and customize your dashboard in any way you see fit. The great thing about Excel is the limitless possibilities to customize and create something new. While this dashboard isn't the most complex or ambitious project in the world, it gives you a sense of how to take an Excel file full of unstructured data and turn it into a useful Excel dashboard. Feel free to send me an email and let me know your thoughts or request new types of projects.